Jui-Te Lin, MS, PT, Stephen Sprigle, PhD, PT
School of Applied Physiology, Georgia Institute of Technology, Atlanta, GA
ABSTRACT
The objective of this study was to develop a reliable and valid test to evaluate resistive energy losses during straight and turning trajectories. A coast-down test was developed to measure decelerations of a loaded manual wheelchair. The deceleration was measured by two encoders attached to the drive wheel axles. To better address the wheelchair resistance in everyday use, the coast-down test incorporated curvilinear trajectories. Eight deceleration trials were repeated to test repeatability. Coast-down tests were performed with two different weight distributions and three tire inflation levels (100%, 75%, and 50% of tire inflation). We found that increased loading on driving wheels and decreased tire pressures will mainly increase decelerations during turning trajectories. The results demonstrated satisfactory repeatability and sensitivity for detecting deceleration changes while adjusting mass distributions and tire pressures. This indicates that the new coast-down test can serve as a good reference for evaluating resistive losses during free-wheeling maneuvers.
BACKGROUND
For the purpose of manual wheelchair (MWC) locomotion, users need to apply energy to maneuver wheelchairs. Thus the performance of user mobility depends on muscle strength, locomotion skills, MWC properties (materials, adjustments, parameters, etc.), and substantial energy loss by the MWC (Sauret et al., 2012; Sawatzky, Kim, & Denison, 2004) . Based on wheelchair properties, the energy loss is largely a result of rolling resistance, bearing resistance, driving wheels (DWs) scrub, and casters scrub. Additional frictional factors, such as drag, frame joint losses, and cushion viscosity, may also affect the resistance.
Typically, MWC users apply increased force to compensate energy loss, leading to increased metabolic demand (Sawatzky et al., 2004), and elevated risk for upper limb injury. Therefore, understanding wheelchair resistance is crucial to helping MWC users improve their capacity for mobility (Koshi et al., 2006) .
Wheelchair resistance has typically been measured through drag test on treadmills (Mason, van der Woude, Lenton, & Goosey-Tolfrey, 2012). Although this type of experimental design can provide valuable information in rolling resistance, it cannot address the influence of inertia in over-ground motion. Coasting deceleration test is another common method to address the influence of wheelchair resistance (Bascou et al., 2013). By using this technique, studies have shown that wheelchair configurations and surface conditions can significantly affect the rolling resistance (Kwarciak, Yarossi, Ramanujam, Dyson-Hudson, & Sisto, 2009; Sauret et al., 2012) . However, straight coast-down tests do not include losses due to tire scrub.
In turning maneuvers, caster and DW scrub on the ground when changing orientation. This scrubbing influences turning resistance (Frank & Abel, 1989). Moreover, rotational inertia of the wheelchair also impact turning resistance (Caspall, Seligsohn, Dao, & Sprigle). In daily life, MWC users incorporate a great deal of turning into their maneuver. Therefore, it is important to consider energy losses during both straight and turning maneuvers and how these losses vary across different wheelchair designs and configurations.
The goal of this study was to design a reliable and valid free-wheeling coast-down test to evaluate wheelchair deceleration during straight and curvilinear paths. This study also addressed changes in rolling resistance across mass distribution and tire pressure.
METHOD
Instrumentation
Test mannequin.
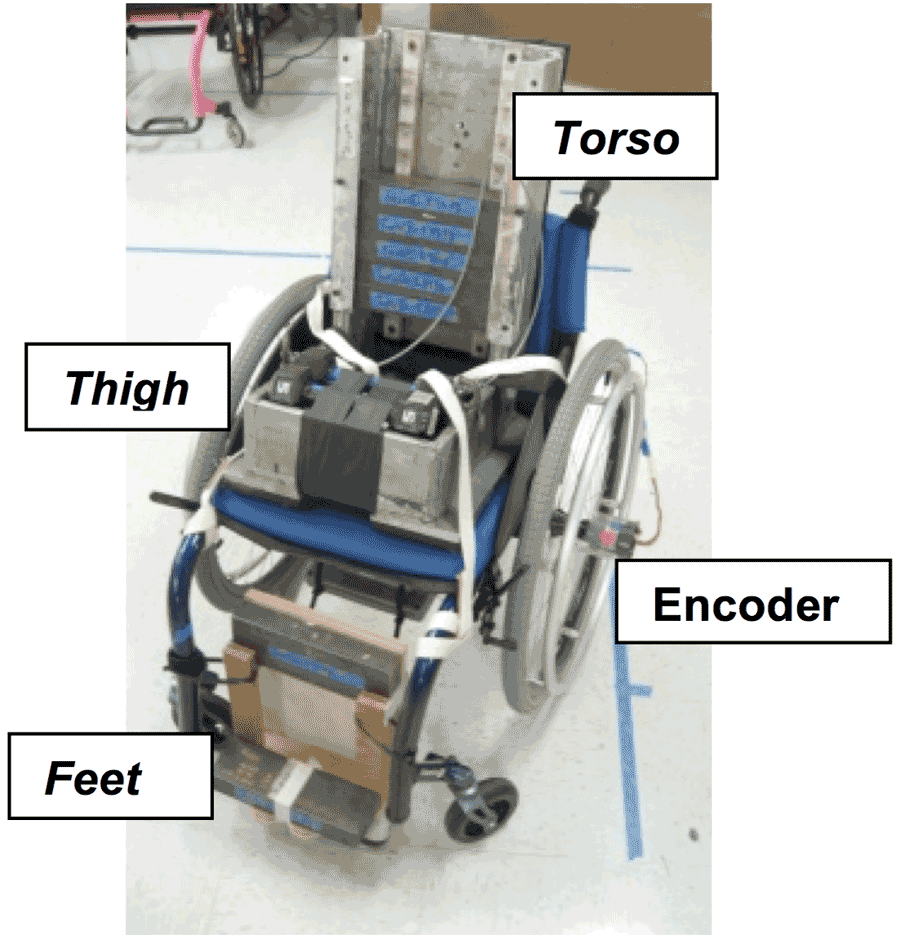 Figure 1. The setup of testing wheelchair
To avoid the confounding factor of body movement, a 75 kg ISO 7176-11 dummy was used. This dummy was configured to impart two different weight distributions onto the DWs (94% and 83%). This was achieved by moving a 5.5kg weight from torso to footrest (Figure 1 and Table 1).
Wheelchair configurations.
ATiLite Aero Z series was used for all tests. It had 24” spoke wheels with pneumatic tires and axle position was set at 10.2 cm from the back rest (Figure 1 and Figure 2). To evaluate the influence of tire pressure, testing was performed at 75 psi (100%), 55 psi (75%), and 38psi (50% of tire inflation).
iMachine.
Center of mass, weight distribution and rotational moment of inertia (Izz) were measured using the iMachine, which was designed to measure system inertias and mass distributions. (Eicholtz, Caspall, Dao, Sprigle, & Ferri, 2012), Horizontal distance (u) from drive wheel axle to center of mass (COM) was used to define mass distribution (Figure 2).
Wheelchair encoders.
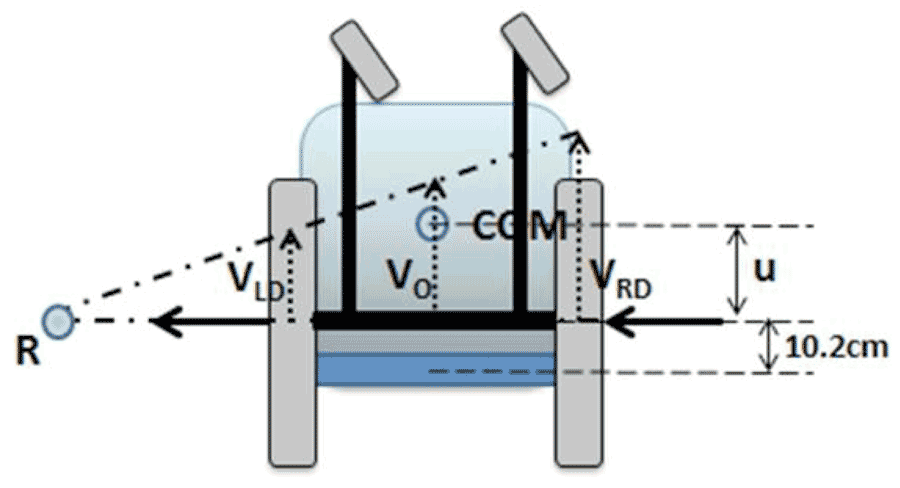 Figure 2. The parameters of testing wheelchair. Notes: R: rotation point; COM: center of mass; VLD: the velocity of left driving wheel; VRD: the velocity of right driving wheel; VO: the velocity of COM; u: horizontal distance from drive wheel axle to COM.
The deceleration values from each DW were measured by two axle-mount encoders. These encoders are compact and light, thus not significantly affecting wheelchair properties (Figure 1). These two encoders were connected to a data acquisition system (LabJack U6, USA), which sampled at a 400 Hz. The setup of the measurement system is displayed in Figure 1.
Coast-down test
The coast-down test provided a deceleration value for the free-wheeling phase. During turning trajectory, only one side of DW was locked. To obtain a repeatable value, the following phases had been controlled during each trajectory (straight and turning): (1) push phase: the MWC was manually pushed to 0.3-1.11 m/s by investigators; (2) release phase: the MWC was released at the same moment and direction within each trajectory; (3) free deceleration phase: lasts at least 1.2s and is used for data processing; and (4) stop phase.
Data Analysis
To calculate deceleration, time-series velocity data was low-pass filtered at 2 Hz. The deceleration value during each trial was determined from a linear regression coefficient. The coefficient of determination (r2) in all linear regression models were > 0.96. Figure 3 shows a linear regression of a sample of velocity versus time during the deceleration period.
Post processing of all deceleration values was fed into custom-made software (Matlab 2013, MathWorks, USA). Distributions of variables were examined and transformations were made where necessary. Coefficient of variation (CV) in eight times of trial was used to evaluate the reliability of measurements. Independent t-test of each trajectory was performed to evaluate whether there was difference between two different days.
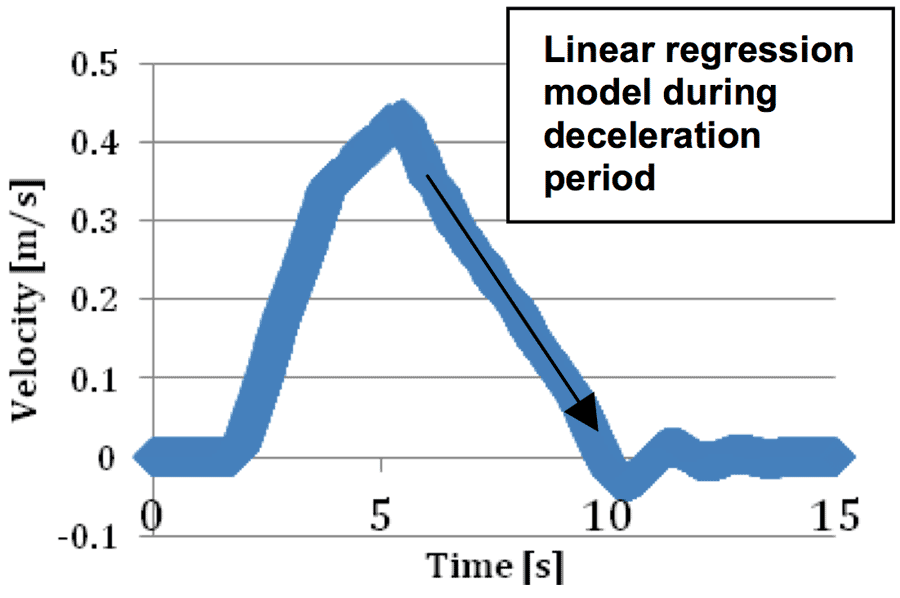 Figure 3 Sample of a speed versus time slope during the coast-down test in left turn
For each trajectory, separate independent t-test of the deceleration was applied for two mass distributions (94% and 83% loading on DWs). A 3×3 repeated-measure ANOVA was performed in wheelchair decelerations as a function of trajectories (left turn, right turn, and straight) and tire pressures (75, 55, and 37 psi) by using the dummy with 83% loading on DW. Differences were determined to be statistically significant at a level of 0.05.
RESULTS
Table 1 shows information of inertia and mass distribution from each dummy setup.
|
DM(kg) |
Izz(kgm2) |
u(m) |
Load on DW(%) |
Load on Casters(%) |
|---|---|---|---|---|---|
RMD |
75.87 |
4.37 |
0.03 |
94.1 |
5.9 |
FMD |
75.87 |
5.26 |
0.06 |
83.3 |
16.7 |
Note: RMD: rearward mass distribution; FMD: forward mass distribution ; DM: dummy mass; Izz:inertia of the system about its CG measured using iMachine; u : Horizontal distance from drive wheel axle to COM; DW: driving wheels |
|||||
Across all configurations, the repeatability of deceleration values was very good with CV less than 6.2% for the eight coast-down trials (Table 2). In addition, no significant differences existed in deceleration values measured on two different days for all trajectories (Straight: p=0.51; Left: p=0.33; Right: p=0.16).
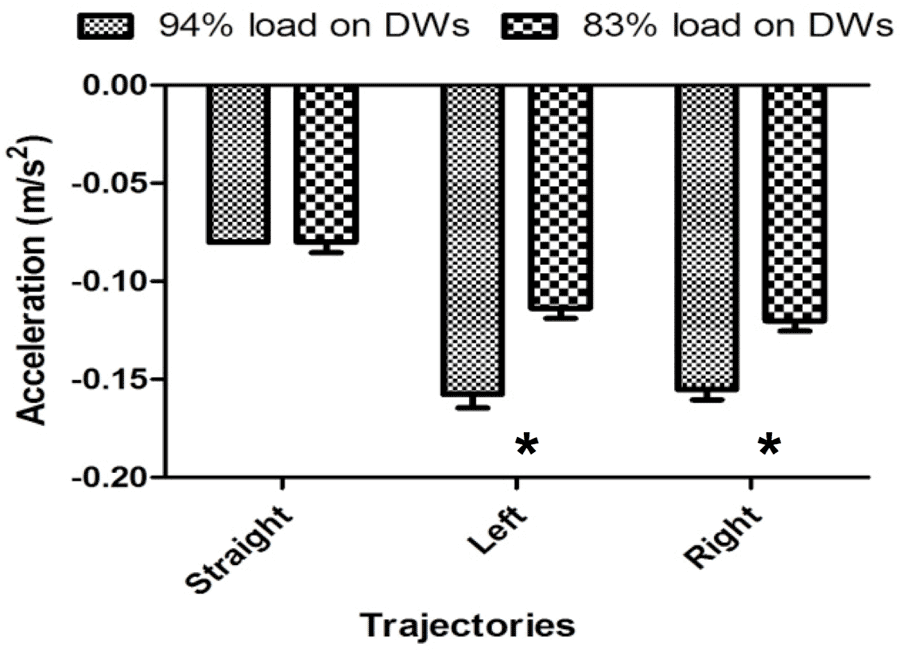 Figure 4. Comparison of acceleration values for three trajectories (straight, left, and right turn) between two mass distributions (94% and 83% load on the DWs). * significant main effect (p<0.01)
 No differences existed in deceleration during straight trajectory across the two different weight distributions (p=1.0), but both the left and right turn trajectories had significantly greater deceleration for 94% compared to 83% loading on DWs (p<0.01, p<0.01, respectively) (Figure 4).
Table 2 shows the deceleration values by using the test dummy with 83% weight on the drive wheels and 3 different inflation levels. The pattern of difference in wheelchair deceleration among tire pressures was significantly different between turning and straight trajectories, F (4, 28) = 14.08, p<0.01, partial η2= 0.67. There was a significant difference in deceleration value among trajectories averaged across tire pressures, F (2, 28) = 656.47, p<0.01, partial η2= 0.99. During either left (Mean (M) =-0.14, standard error (SE) =0.00) or right (M=-0.14, SE=0.00) turning trajectory, wheelchair had greater deceleration than straight trajectory averaged across tire pressures (M =-0.09, SE =0.00), p<0.01, p<0.01, respectively. Since the wheelchair is symmetrical, the deceleration values should not differ across left and right turning trajectory and that was confirmed by the results (p=0.1). However, we found that there was a significant difference in deceleration value among tire pressures averaged across trajectories, F (2, 28) = 172.97, p<0.01, partial η2= 0.96. With decreasing tire pressures from 100%, 75%, to 50% of tire inflation, wheelchair had a consistent pattern in significantly increasing deceleration averaged across trajectories (M=-0.11, SE=0.00; M=-0.12, SE=0.00; M=-0.13, SE=0.00, respectively), ps<0.01 (Figure 5).
|
|
|
Acceleration |
|
# |
TP |
Trajectories |
Value (m/s2) |
CV (%) |
1 |
75 |
Straight |
-0.080±0.005 |
6.2% |
2 |
55 |
Straight |
-0.084±0.005 |
5.1% |
3 |
37 |
Straight |
-0.093±0.007 |
5.6% |
4 |
75 |
Left |
-0.114±0.005 |
4.2% |
5 |
55 |
Left |
-0.135±0.005 |
4.6% |
6 |
37 |
Left |
-0.156±0.005 |
3.7% |
7 |
75 |
Right |
-0.120±0.005 |
4.2% |
8 |
55 |
Right |
-0.134±0.005 |
3.9% |
9 |
37 |
Right |
-0.151±0.004 |
1.7% |
Note: TP: Tire pressure (psi); CV: Coefficient of variation |
||||
DISCUSSION
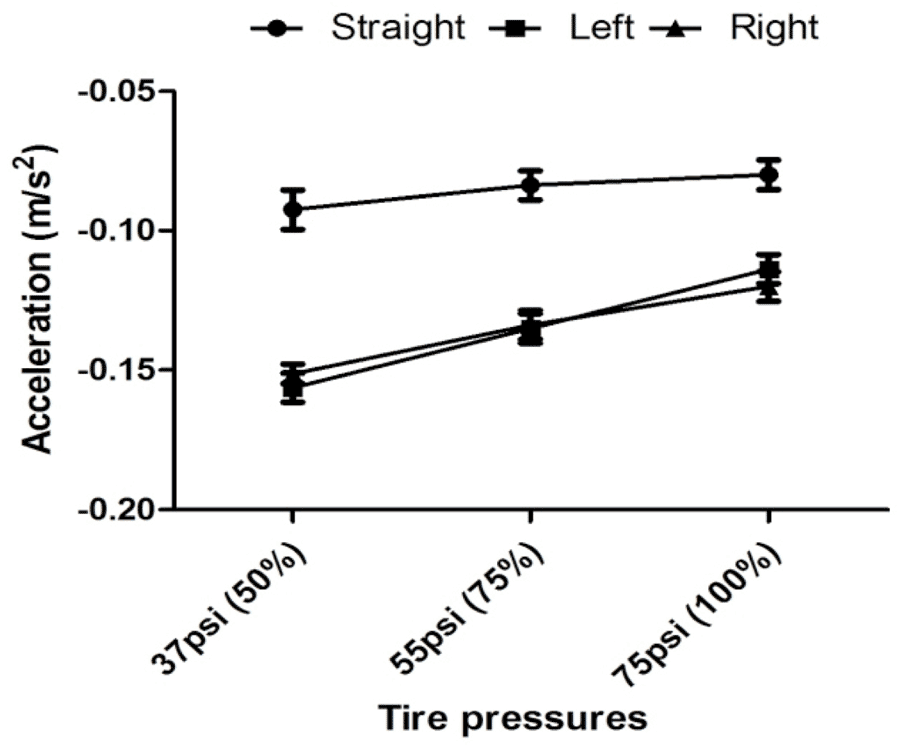 Figure 5. Comparison of acceleration values for three tire pressures with FMD during three trajectories.
 MWC decelerations can be reliably measured using the described methods. Results indicated good repeatability across different configurations and in both straight and turning trajectories. Decelerations are markedly higher during turning which illustrates the heightened resistive losses due to tire scrub and other possible influences. In addition, the differences in decelerations across inflation levels are greater during turning than straight trajectories. These results corroborate the stated need for such a test because it permits a greater sensitivity to differences. Although we did not find a significant increase in deceleration in straight trajectory while total load on front wheels varied from 5.9% to 16.7%, we did notice a significant influence in turning trajectories. According to our results, wheelchair with 83% loading on the DWs decreased deceleration by 28.1% compared to 94% loading on the DWs. It is possible that reducing loading on DWs can decrease the turning resistance, which is mainly from DWs instead of casters scrub. In addition, we can understand that changing load distribution has greater impact on resistance during turns than straight trajectory. Overall, this proposed method provided a sensitivity to distinguish the influence of load distribution.
Compared to the straight trajectory, turning coast-down test had significantly greater deceleration. Since wheelchair friction includes not only rolling resistance, but also wheel scrub, it is reasonable that wheelchair may face greater wheel scrub during turning than during straight trajectory.
Prior studies have confirmed that tire type and pressure influence rolling resistance and thus can change propulsion effort (Kauzlarich & Thacker, 1985; Kwarciak et al., 2009; Sawatzky et al., 2004) . Pneumatic tires have been shown to have lower rolling resistance than solid tires (Kauzlarich & Thacker, 1985; Kwarciak et al., 2009) . Moreover, pneumatic tires with different inflation levels have been shown to have different rolling resistance (Sawatzky et al., 2004). By using the same type of pneumatic tires, Sawatzky et al. found that a tire inflated to 100% had significantly less rolling resistance than tires inflated to 50%, but did not find a difference comparing tires inflated to 100% and 75%. Our results both corroborate and extend these results to add to knowledge about tire inflation. During straight trajectories, wheelchair deceleration at 75% and 50% inflation levels were 5% and 16.3% greater than that at 100% inflation, respectively. However, during turning, inflation levels had more influence, with 15.0% and 31.2% increases at 75% and 50% inflation levels, respectively. These results demonstrate that considering both straight and turning maneuvers can improve the sensitivity for differentiating the influence of tire pressures on wheelchair rolling resistance.
CONCLUSION
The described methods resulted in repeatable measurements of deceleration during straight and turning maneuvers. This technique can be used to evaluate friction factors using the straight and curvilinear coast-down test. Coast-down tests can only measure the influences of resistive losses such as rolling resistance and tire scrub. This test does not reflect the inertial influences that can increase propulsion demand during acceleration. However, because this technique can be used in different trajectories, it can better reflect resistive losses that a wheelchair user will experience during everyday mobility. In future studies, we will consider more wheelchair configurations, such as weight distribution, tire types and wheel sizes.
Knowledge of how different configurations impact wheelchair resistance is advantageous for clinicians and users when selecting or modifying a MWC.
REFERENCES
Research Support, U.S. Gov't, Non-P.H.S.]. Journal of Rehabilitation Research and Development, 22(3), 25-41.
ACKNOWLEDGEMENTS
This study was completed as part of the Mobility RERC, which is funded by the National Institute on Disability and Rehabilitation Research of the U.S. Department of Education. We are grateful for the generosity of Ti Lite, Inc who donated the wheelchair used in this study. The authors thank Morris Huang for providing advices and assistances.
Audio Version PDF Version